

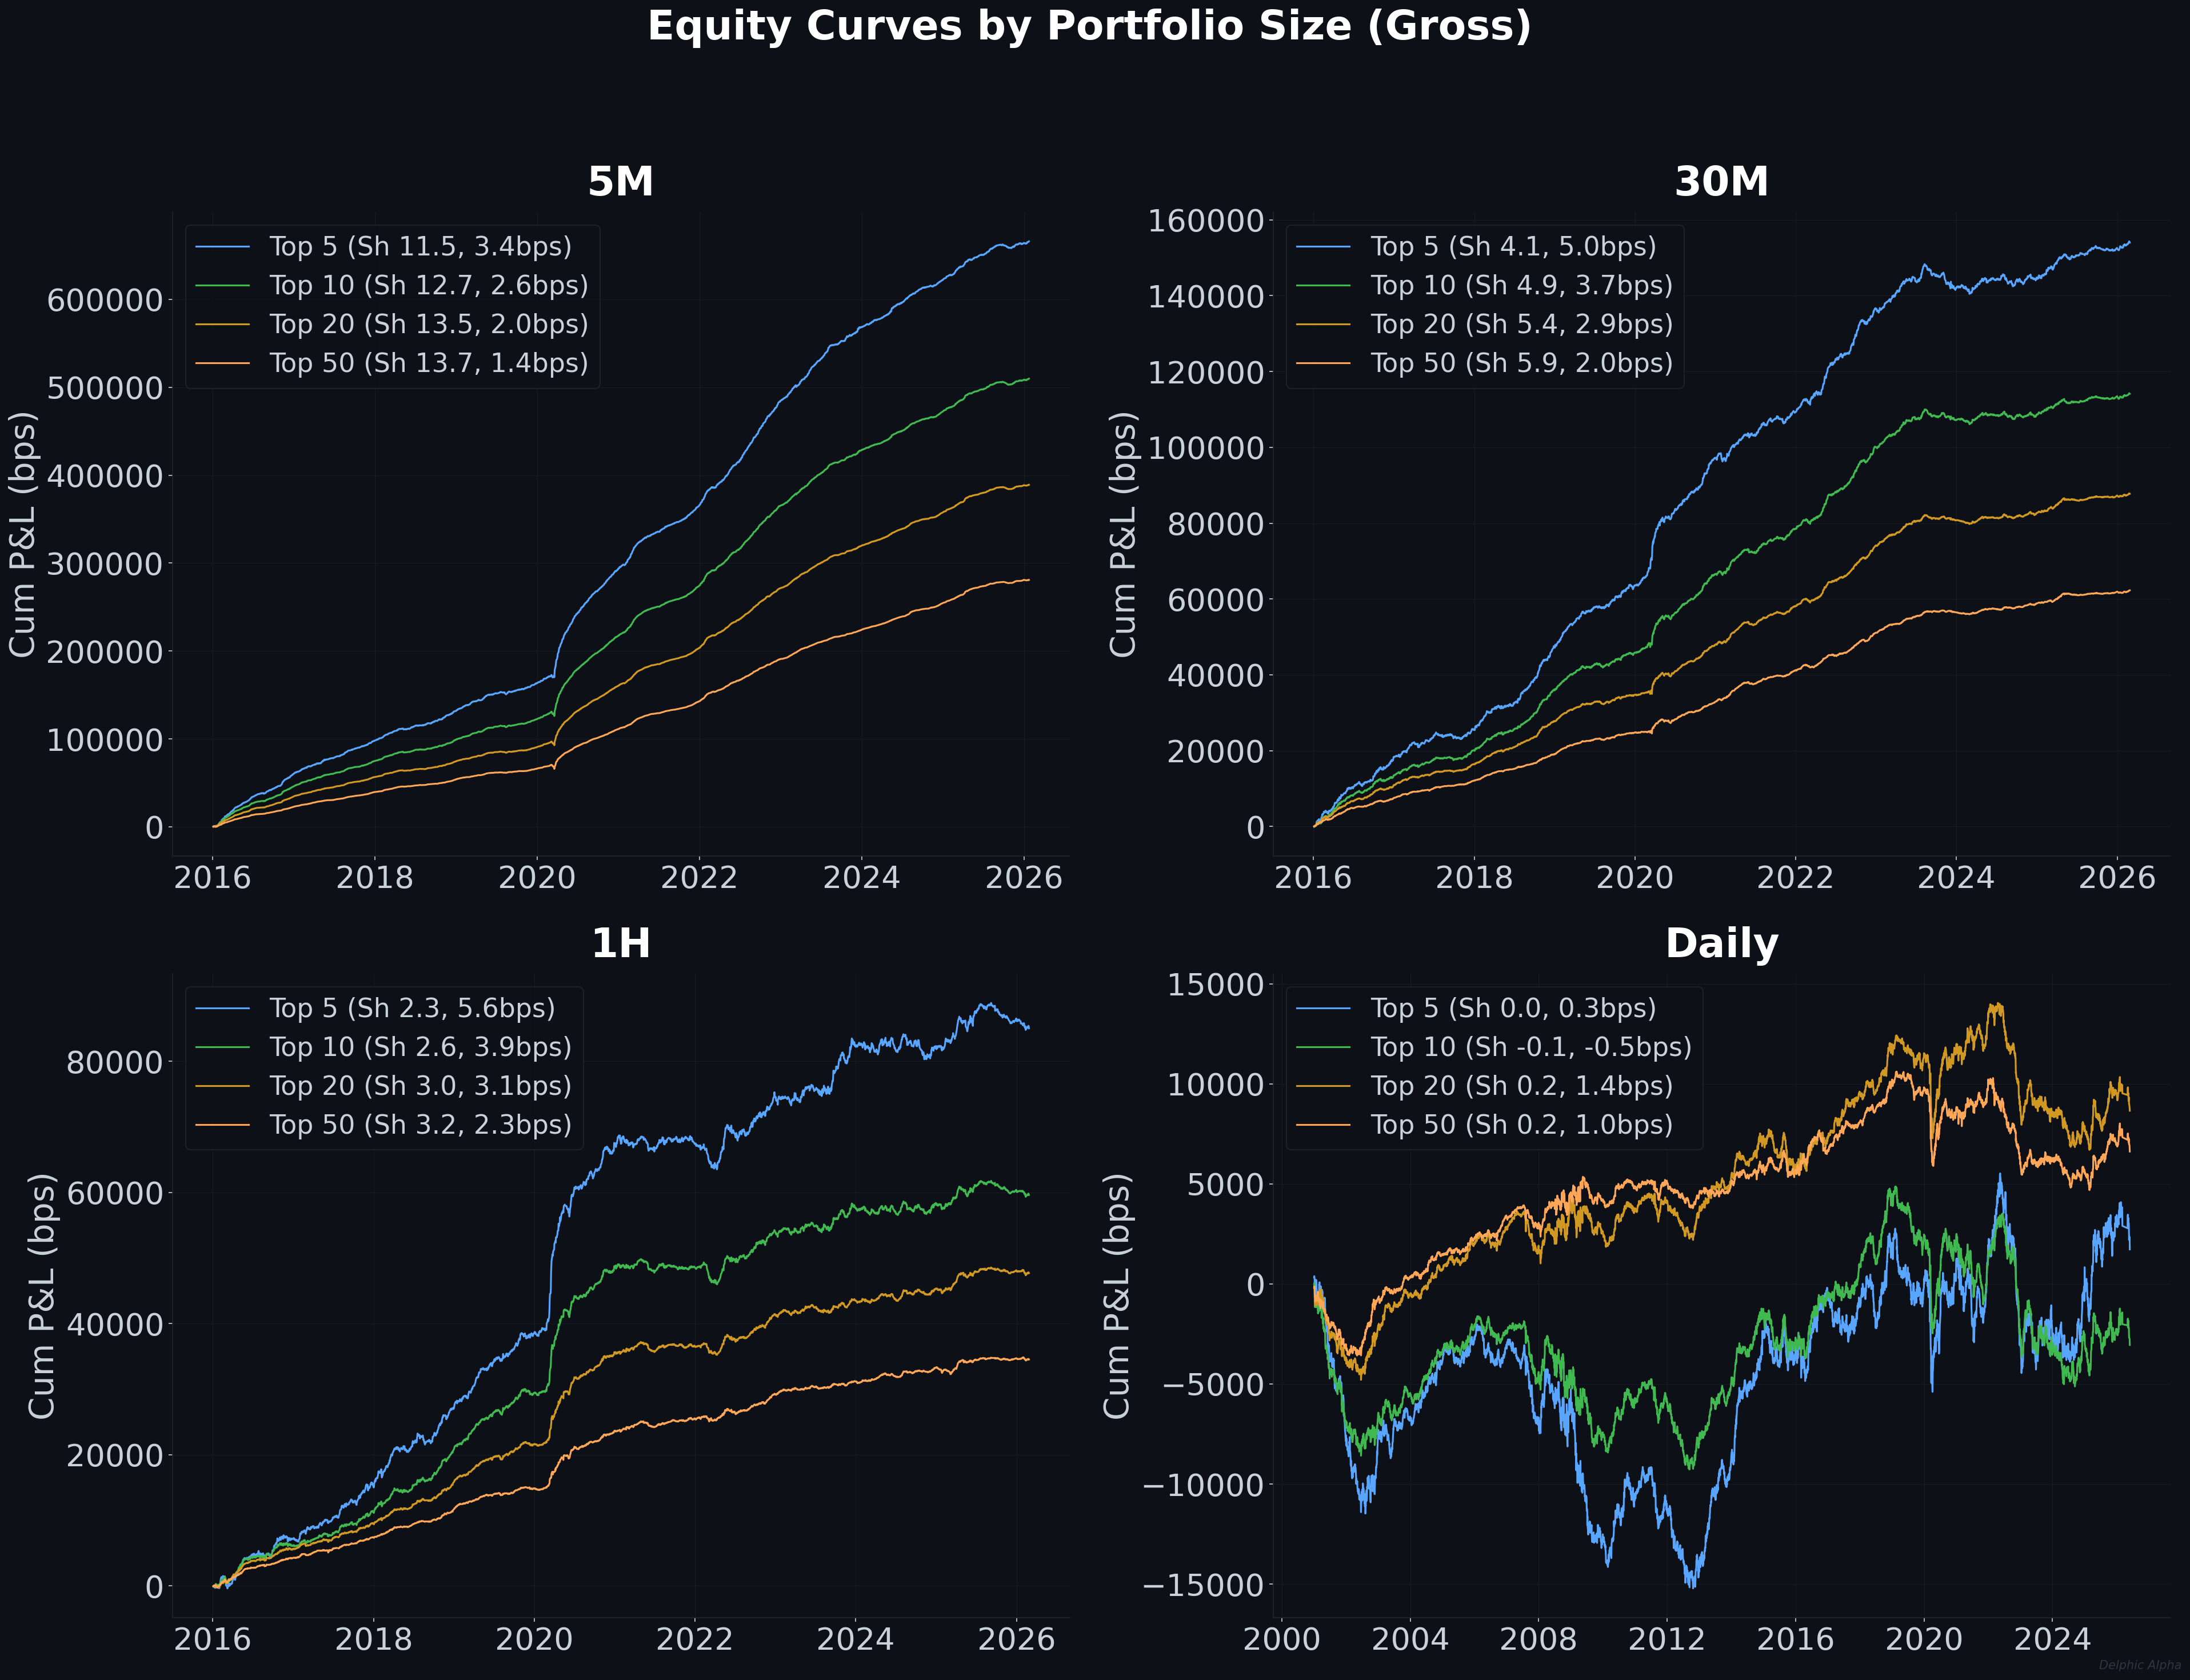
Cross-sectional mean reversion is a good example of quant research where the signal is easy to find but the real question is whether it survives execution. I tested up to 3,365 rolling liquidity-screened US stocks (3,204 at 5M, 3,263 at 30M/1H, 3,365 daily) across four timeframes, ~40 parameter combinations each, and 10+ years of intraday data to find out.
The Strategy
The canonical cross-sectional reversal. At each bar:
Compute the return over the last N bars for every stock in the universe
Rank all stocks from biggest loser to biggest winner
Long the K biggest losers, Short the K biggest winners
Equal weight within each leg, 1/K per position
Enter at the next bar's open, exit at the next bar's close. If a stock remains in the portfolio at the next rebalance, hold it (position carry) - no exit and re-entry, no cost on the held portion
No indicators, no machine learning, no signal filters. Intraday positions do not cross overnight. I tested this at four frequencies: 5-minute, 30-minute, hourly, and daily. At each, I swept K (portfolio size: 3 to 50) and N (signal lookback: 1 bar to 1 day), giving ~40 combinations per timeframe.
Everything below is a backtest. Stocks must pass a prior-year liquidity filter (>$5M median daily dollar volume, >$5 price): 3,204 at 5M, 3,263 at 30M/1H, 3,365 daily. Intraday ranges: 5M January 2016 to January 2026; 30M/1H January 2016 to February 2026. Daily: January 2000 to June 2026 (26 years).
